Interactive museum exhibits shape memory and spark curiosity. Interactive museum exhibits help visitors learn by doing. They improve accessibility and extend reach. Museums measure success with attendance, dwell time, and repeat visits. Designers must plan goals, select tools, and test with real people. The article explains why interactive museum exhibits matter and how to design them for clear impact.
Key Takeaways
- Interactive museum exhibits engage visitors actively, enhancing learning retention and accessibility for diverse audiences.
- Designers prioritize clear goals, simple interactions, and accessibility features to create impactful exhibits that cater to all visitors.
- Effective exhibits balance quick engagement and deeper exploration to accommodate varied visitor attention spans and encourage longer visits.
- Durability, modular design, and ongoing maintenance planning ensure interactive exhibits remain reliable and operational.
- Integration of analytics and visitor feedback guides continuous improvement, linking exhibit engagement to measurable success.
- Technology choices should align with audience needs, budget, and exhibit goals to maximize educational value and ease of use.
Why Interactive Exhibits Matter: Learning, Accessibility, and ROI
Interactive museum exhibits change how people learn. They invite visitors to act, not just look. Active visitors form stronger memories. Schools report higher retention when students use hands-on displays. Museums also reach new audiences through multisensory elements. Touch screens help visual learners. Audio guides help people with low vision. Tactile models help children and adult visitors who need physical reference.
Interactive museum exhibits also improve accessibility. Designers add captions, adjustable volume, and clear fonts. They offer alternative input methods like switches and gesture control. They include plain-language labels and short audio clips. These features help visitors with cognitive, hearing, or mobility needs. Museums that adopt these features comply with accessibility guidelines. They also reduce barriers for many visitors.
Interactive museum exhibits drive return visits and revenue. Visitors stay longer near interactive pieces. Longer visits often lead visitors to purchase memberships or gifts. Schools and tour groups book more repeat visits when exhibits support curricula. Museums can track engagement through sensors and ticket data. These metrics link interactive museum exhibits to clear financial outcomes. Funders and boards find these metrics persuasive. They support further investment in interactive experiences.
Design Principles for Engaging Interactive Exhibits
Designers start with clear goals. They name the learning outcome, desired behavior, and accessibility standard. They prioritize those goals during concept work. Designers test early with staff and local visitors. Early tests reveal confusion, broken interactions, and unclear instructions. Teams iterate until most testers complete the main task without help.
Designers keep interactions simple. They limit choices and reduce steps. Visitors learn faster when the interface shows one clear action. Icons tell a visitor what to do. Short prompts guide them. Designers write label text in plain language. They also use progressive disclosure to reveal advanced features.
Designers plan for different visit lengths. They create quick interactions for passersby and deep interactions for engaged visitors. A single exhibit can offer a 30-second loop and a 10-minute deep dive. This structure increases dwell time without blocking other visitors. It also suits family groups with mixed attention spans.
Designers consider durability and maintenance. They choose hard-wearing materials and serviceable components. They design with modular parts so staff can swap a broken element quickly. They log maintenance tasks and track mean time between failures. This planning reduces downtime and keeps interactive museum exhibits operating reliably.
Designers include clear analytics from the start. They define key metrics such as completions, average time, and repeat interactions. They place anonymous sensors or use built-in logging to collect data. They review data weekly at first, then monthly. They use the data to refine content and fix friction points. This approach turns observations into simple, specific changes.
Choosing Technology, Mapping Visitor Flow, and Measuring Success
Choosing technology depends on the audience and budget. Low-cost tech like NFC tags and tablets works for small budgets. High-impact tech like projection mapping and VR suits larger budgets and special exhibitions. Designers weigh cost, staff skill, and expected lifetime. They choose components with clear vendor support and swap options.
Designers match technology to tasks. They pick sensors for presence detection. They pick touchscreens for exploration. They pick physical controls for visitors who prefer tangible input. They avoid novelty tech that adds complexity without clear learning value.
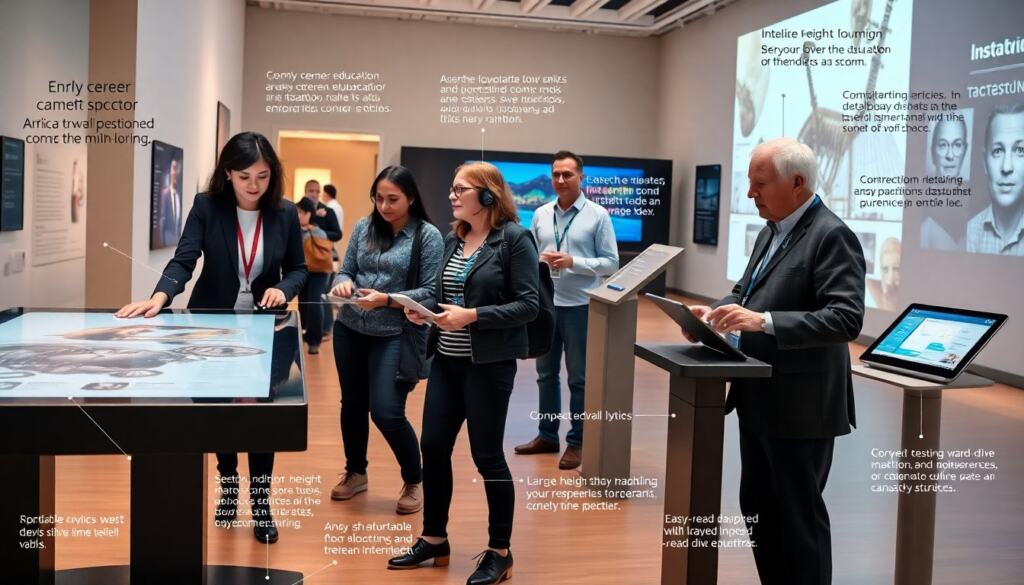
Designers map visitor flow before building. They draw the entry, main paths, and exit. They place interactive museum exhibits where sightlines allow group viewing. They design queuing space for popular pieces. They test flow with role-play and simple prototypes. They adjust placement to prevent bottlenecks and ensure staff access.
Designers create clear wayfinding. Signs use simple verbs and icons. Lighting highlights touchpoints. Floor markers cue group gathering without blocking traffic. These choices make the visit calm and focused.
Designers measure success with a mix of qualitative and quantitative methods. They collect metrics such as time on task, completion rate, and repeat interactions. They gather short exit interviews or tablet feedback to capture visitor sentiment. They run A/B tests on wording, iconography, and timing. They track school bookings and membership conversions after exhibit changes.
Designers use data to prioritize fixes. A low completion rate on a key task moves to the top of the backlog. High dwell time but low learning result suggests content revision. Staff observations validate sensor data. This cycle of measure, test, and change keeps interactive museum exhibits effective.